Research finds that one well-known guideline may not work for everyone.
Posted May 02, 2014
What is the acceptable minimum age for your own (and others’) dating partners? When this question comes up in conversation, someone inevitably cites the “half your age plus seven” rule (link is external). This rules states that by dividing your own age by two and then adding seven you can find the socially-acceptable minimum age
of anyone you want to date. So if you’re a 24 year-old, you can feel
free to be with anyone who is at least 19 (i.e., 12 + 7) but not someone
who is 18.1 The (lesser-applied) other side of the rule defines a maximum
age boundary: Take your age, subtract 7, and double it. So for a
24-year old, the upper age limit would be 34 (i.e., 17 * 2). With some
quick math, the rule provides a minimum and maximum partner age based on
your actual age that, if you choose to follow it, you can use to guide
your dating decisions.
A Chart of the Rule's Max and Min Partner Age Discrepancies Based on a Person's Actual Age
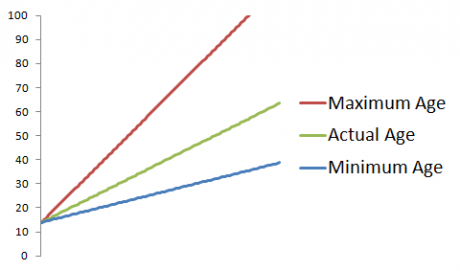 The utility of this equation is that it lets you chart acceptable age
discrepancies that adjust over the years. According to the rule, for
example, a 30-year-old should be with a partner who is at least 22,
while a 50-year-old’s dating partner must be at least 32 to not attract
(presumed) social sanction.
But how legitimate is this rule? Does it match our scientific understanding of age-related preferences for dating? Does it always apply? Should it ever?
Let's examine it:
How well does the rule reflect scientific evidence for age preferences?
Researchers Buunk and colleagues (2000) asked men and women to identify the ages they would consider when evaluating someone for relationships of different levels of involvement. People reported distinct age preferences for marriage; a serious relationship; falling in love; casual sex; and sexual fantasies. Did they follow “the rule”?
Based on the figures Buunk and colleagues (2000) provided (and thus the numbers are only informed approximations), I replotted their data superimposing the max and min age ranges defined by the half-your-age-plus-7 rule. Now we can see how well the rule corresponds with people’s reported acceptable ages.
Men’s preferred minimum partner age: Let’s start with minimum age preferences reported by heterosexual men. In Figure 1, the solid black line represents the rule’s calculation for minimum acceptable range. You can see that men are basically operating by the rule for minimum age preferences for marital relationships (blue bars) and serious dating relationships (yellow bars). Those age preferences consistently hover around the values denoted by the rule (the black line). If anything, in practice men are more conservative when it comes to preferred marriage, preferring a minimum age higher than the rule would say is OK.
Figure 1: Male Participants' Minimum Preferred Partner Age as Compared to the Rule
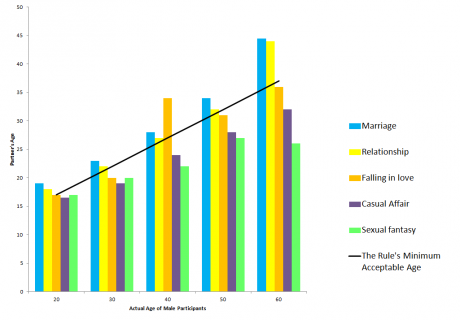 When it comes to sexual fantasies, however, men have minimum age preferences that are younger
than the rule would designate appropriate. For example, this sample of
60-year-old men report that it is acceptable to fantasize about women in
their 20s, which the rule would say is unacceptable. But fantasies, of
course, are not generally subject to public scrutiny and the rule is
only designed to calculate what is socially acceptable in the public eye—so this discrepancy is not necessarily a failure of the rule.
For rule-related involvement (e.g., relationships), 60-year-old men are stating that the minimum acceptable age is around 40ish, which does map much more closely to the rule’s predictions.
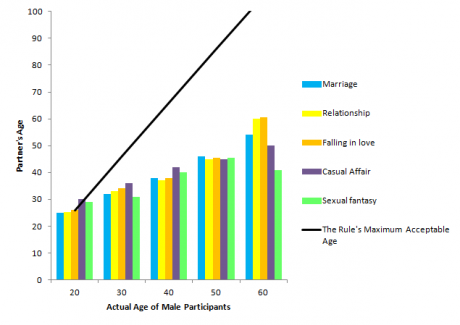
Men’s preferred maximum partner age: The rule states that you can calculate maximum acceptable partner ages by subtracting seven from your own age and multiplying it by 2. Figure 2 clearly shows that the rule’s max-age guidelines for men do not reflect real-world preferences. The rule overestimates the perceived acceptability of men becoming involved with older women. Men do not show a linear increase in maximum age preference that matches the rule’s predictions. Instead, men report maximum acceptable partner ages that hover around their own age through their 40s. After 40, maximum age preferences for most categories remain lower than their own age. Thus the rule for maximum ages is fairly ineffective at capturing what men actually believe is acceptable.
Figure 2: Male Participants' Maximum Preferred Partner Age as Compared to the Rule
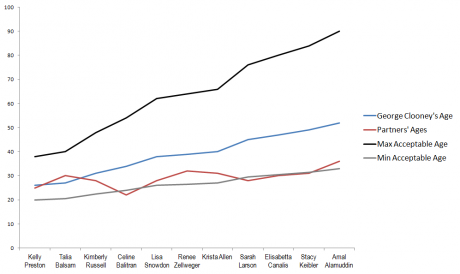
 Case Study: George Clooney. Now let's apply the rule
to actual dating behavior by examining George Clooney’s dating habits.
Clooney has been scrutinized at times for dating younger women, though
not consistently, and this pattern is nicely reflected in a graph of his
own age, his partners’ ages, and the rule’s calculations for minimum
and maximum acceptable ages. Only twice has he become involved with
women whose ages were outside the rule’s guideline. He approached the
line with two other partners, but is well within the threshold in his
marriage with Amal Alamuddin.
 Does the rule work for women?
The minimum rule (half-your-age-plus-seven) seems to work for men, although the maximum rule falls short, failing to reflect empirical age-related preferences. How well does the rule capture women’s preferences?
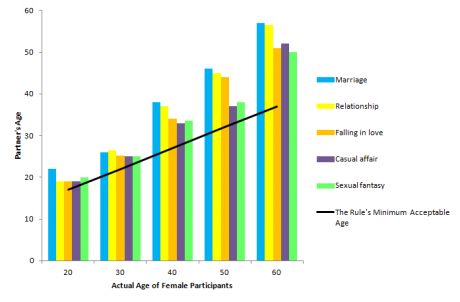
Women’s preferred minimum partner age: Below are the data from Buunk et al.’s (2000) study on women’s minimum age preferences; the rule’s age calculations are represented by the solid line. In general, the figure shows that women are reporting minimum age preferences that exceed the rule’s predictions. In other words, while the rule states that 40-year-old women can feel comfortable dating 27-year-old men, this does not reflect the social preferences and standards of women. Women in their 40s think that approximately 35 or older is acceptable for marriage or a relationship. Even when fantasizing, such women’s minimum age preference remains over 30. The rule’s calculated minimum acceptable partner ages seem to fit men better than women.
Figure 3: Female Participants' Minimum Preferred Partner Age as Compared to the Rule
 Women’s preferred maximum partner age: Examining
maximum preferences, again the rule is more lenient, offering an age
range with which most people are not comfortable. The rule states that
it is acceptable for 30-year old women to date men who are up to 46
years old, but in actuality, 30-year-old women state that their max
acceptable partner age would be less than 40 (around 37). The rule
underestimates women’s reported preferences in their 20s, but the gap
between reports of what is socially acceptable and the rule itself widen
over time.
Figure 4: Female Participants' Maximum Preferred Partner Age as Compared to the Rule
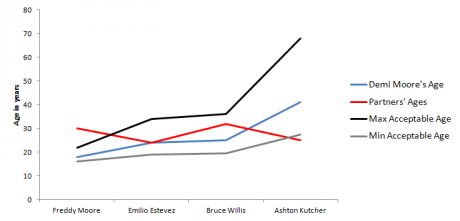
 Case Study: Demi Moore. Let’s take a look at Demi
Moore, who at times has been criticized for dating men who differ
substantially from her own age. As you can see from the graph, one
partner exceeded the rule’s calculated acceptable maximum age, while
Ashton Kutcher’s age fell short of the socially-acceptable minimum age
when they first started dating in 2003. By the time of their separation
in 2011, however, Kutcher, then 33 had crossed the minimum threshold
(31.5) defined by the rule.
 How effective is the rule?
Curious outsiders are quick to judge when they can see a wide age gap between two romantic partners. Maybe this is why the rule is so appealing. In a world in which many social norms are often unspoken, the half-your-age-plus-7 rule concretely defines a boundary.
But the rule does not map perfectly onto actual reports of what is socially acceptable. At times it is too stringent, but most often it appears too lenient, condoning age pairings with which most people are not comfortable. So if you are following the half-your-age-plus-7 rule, know that it may not be perfect or truly mirror age-related preference. You might also take care to refer to the maximum age judiciously—the minimum age guideline seems to be more on target (and more so for men than women).
 End Notes
1. When you’re 26, however, this person would be 20 and would be right at the line of your age-minimum threshold (13 + 7). In a few more years, you’ll be 28 and this person will be 22, above your new threshold of 21 (14+7).
A Chart of the Rule's Max and Min Partner Age Discrepancies Based on a Person's Actual Age

Source: Author
But how legitimate is this rule? Does it match our scientific understanding of age-related preferences for dating? Does it always apply? Should it ever?
Let's examine it:
How well does the rule reflect scientific evidence for age preferences?
Researchers Buunk and colleagues (2000) asked men and women to identify the ages they would consider when evaluating someone for relationships of different levels of involvement. People reported distinct age preferences for marriage; a serious relationship; falling in love; casual sex; and sexual fantasies. Did they follow “the rule”?
Based on the figures Buunk and colleagues (2000) provided (and thus the numbers are only informed approximations), I replotted their data superimposing the max and min age ranges defined by the half-your-age-plus-7 rule. Now we can see how well the rule corresponds with people’s reported acceptable ages.
Men’s preferred minimum partner age: Let’s start with minimum age preferences reported by heterosexual men. In Figure 1, the solid black line represents the rule’s calculation for minimum acceptable range. You can see that men are basically operating by the rule for minimum age preferences for marital relationships (blue bars) and serious dating relationships (yellow bars). Those age preferences consistently hover around the values denoted by the rule (the black line). If anything, in practice men are more conservative when it comes to preferred marriage, preferring a minimum age higher than the rule would say is OK.
Figure 1: Male Participants' Minimum Preferred Partner Age as Compared to the Rule

Source: Author
For rule-related involvement (e.g., relationships), 60-year-old men are stating that the minimum acceptable age is around 40ish, which does map much more closely to the rule’s predictions.
Men’s preferred maximum partner age: The rule states that you can calculate maximum acceptable partner ages by subtracting seven from your own age and multiplying it by 2. Figure 2 clearly shows that the rule’s max-age guidelines for men do not reflect real-world preferences. The rule overestimates the perceived acceptability of men becoming involved with older women. Men do not show a linear increase in maximum age preference that matches the rule’s predictions. Instead, men report maximum acceptable partner ages that hover around their own age through their 40s. After 40, maximum age preferences for most categories remain lower than their own age. Thus the rule for maximum ages is fairly ineffective at capturing what men actually believe is acceptable.
Figure 2: Male Participants' Maximum Preferred Partner Age as Compared to the Rule

Source: Author

Source: Author
The minimum rule (half-your-age-plus-seven) seems to work for men, although the maximum rule falls short, failing to reflect empirical age-related preferences. How well does the rule capture women’s preferences?
Women’s preferred minimum partner age: Below are the data from Buunk et al.’s (2000) study on women’s minimum age preferences; the rule’s age calculations are represented by the solid line. In general, the figure shows that women are reporting minimum age preferences that exceed the rule’s predictions. In other words, while the rule states that 40-year-old women can feel comfortable dating 27-year-old men, this does not reflect the social preferences and standards of women. Women in their 40s think that approximately 35 or older is acceptable for marriage or a relationship. Even when fantasizing, such women’s minimum age preference remains over 30. The rule’s calculated minimum acceptable partner ages seem to fit men better than women.
Figure 3: Female Participants' Minimum Preferred Partner Age as Compared to the Rule

Source: Author
Figure 4: Female Participants' Maximum Preferred Partner Age as Compared to the Rule

Source: Author

Source: Author
Curious outsiders are quick to judge when they can see a wide age gap between two romantic partners. Maybe this is why the rule is so appealing. In a world in which many social norms are often unspoken, the half-your-age-plus-7 rule concretely defines a boundary.
But the rule does not map perfectly onto actual reports of what is socially acceptable. At times it is too stringent, but most often it appears too lenient, condoning age pairings with which most people are not comfortable. So if you are following the half-your-age-plus-7 rule, know that it may not be perfect or truly mirror age-related preference. You might also take care to refer to the maximum age judiciously—the minimum age guideline seems to be more on target (and more so for men than women).

Source: Carlos Horta/Shutterstock
1. When you’re 26, however, this person would be 20 and would be right at the line of your age-minimum threshold (13 + 7). In a few more years, you’ll be 28 and this person will be 22, above your new threshold of 21 (14+7).
没有评论:
发表评论